Autoplan - Rapport de Fonctionnement
Date de création du rapport: Mon Oct 24 11:02:54 UTC 2022
Période concernée: {(utc) 2022-10-24 10:43:28 (Unix 1666608208)} à {(utc) 2022-10-24 10:29:43 (Unix 1666607383)}
Retour au menu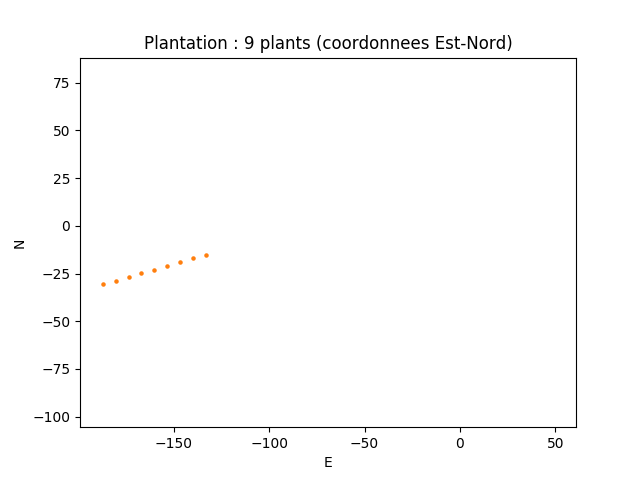
Incidents
1666606608 (utc) 2022-10-24 10:16:48 [CheckPositionTariereInit] -> approche, CL11666606608 (utc) 2022-10-24 10:16:48 [CheckPositionDefaultPlanteuse] -> planteur1666606608 (utc) 2022-10-24 10:16:48 [CheckPositionTariereInit] -> approche, CL11666606608 (utc) 2022-10-24 10:16:48 [CheckPositionDefaultPlanteuse] -> planteur1666607276 (utc) 2022-10-24 10:27:56 [CheckPositionDefaultPlanteuse] -> tasseur1666607276 (utc) 2022-10-24 10:27:56 [CheckPositionDefaultPlanteuse] -> tasseurWarnings
pas de warningStatistiques Plantations
start_time (unix)error(mm)time_from_last_plant (s)dist_from_last_plant (m)try_nbgps_pos0 (m)gps_pos1 (m)start_planteuse->orientation_startorientation_start->orientation_endorientation_end->pretrou_startpretrou_start->pretrou_baspretrou_bas->pretrou_okpretrou_ok->plant_startplant_start->plant_endlatitudelongitudeIndicateurs
| μ | σ | min | max | D1 | Q1 | median | Q3 | D9 |
| error(mm) | 18.67 | 12.56 | 4.00 | 44.00 | 4.00 | 8.00 | 17.00 | 19.00 | 44.00 |
| time_from_last_plant (s) | 83.88 | 12.60 | 74.00 | 106.00 | 74.00 | 76.00 | 78.00 | 105.00 | 106.00 |
| dist_from_last_plant (m) | 7.00 | 0.02 | 6.97 | 7.05 | 6.97 | 6.99 | 7.01 | 7.01 | 7.05 |
| plant_start->plant_end | 20.00 | 3.53 | 17.00 | 27.00 | 17.00 | 18.00 | 18.00 | 19.00 | 27.00 |
Données
|
1666606647 |
|
7 |
|
- |
|
- |
|
4 |
|
-133.29 |
|
-15.17 |
|
0 |
|
4 |
|
6 |
|
3 |
|
2 |
|
0 |
|
26 |
|
44.87 |
|
-0.38 |
|
|
1666606724 |
|
16 |
|
77 |
|
7.01 |
|
3 |
|
-140.02 |
|
-17.10 |
|
0 |
|
3 |
|
3 |
|
5 |
|
2 |
|
0 |
|
27 |
|
44.87 |
|
-0.38 |
|
|
1666606802 |
|
4 |
|
78 |
|
7.01 |
|
3 |
|
-146.76 |
|
-19.03 |
|
1 |
|
3 |
|
3 |
|
6 |
|
2 |
|
0 |
|
18 |
|
44.87 |
|
-0.38 |
|
|
1666606882 |
|
8 |
|
80 |
|
6.99 |
|
4 |
|
-153.48 |
|
-20.96 |
|
0 |
|
3 |
|
8 |
|
6 |
|
3 |
|
0 |
|
18 |
|
44.87 |
|
-0.38 |
|
|
1666606987 |
|
17 |
|
105 |
|
7.01 |
|
3 |
|
-160.22 |
|
-22.89 |
|
0 |
|
5 |
|
4 |
|
6 |
|
2 |
|
0 |
|
19 |
|
44.87 |
|
-0.38 |
|
|
1666607062 |
|
19 |
|
75 |
|
6.99 |
|
4 |
|
-166.94 |
|
-24.81 |
|
0 |
|
3 |
|
8 |
|
4 |
|
2 |
|
0 |
|
18 |
|
44.87 |
|
-0.39 |
|
|
1666607168 |
|
36 |
|
106 |
|
6.97 |
|
4 |
|
-173.64 |
|
-26.73 |
|
0 |
|
4 |
|
6 |
|
6 |
|
1 |
|
0 |
|
19 |
|
44.87 |
|
-0.39 |
|
|
1666607242 |
|
44 |
|
74 |
|
6.99 |
|
4 |
|
-180.36 |
|
-28.66 |
|
0 |
|
5 |
|
4 |
|
6 |
|
1 |
|
0 |
|
18 |
|
44.87 |
|
-0.39 |
|
|
1666607318 |
|
17 |
|
76 |
|
7.05 |
|
4 |
|
-187.14 |
|
-30.61 |
|
0 |
|
3 |
|
8 |
|
6 |
|
2 |
|
0 |
|
17 |
|
- |
|
- |
|
Statistiques Déplacement de la Machine
t0 (unix)duration (sec)last_azimut_error (deg)last_long_error (m)last_lat_errors (m)Indicateurs
| μ | σ | min | max | D1 | Q1 | median | Q3 | D9 |
| duration (sec) | 28.11 | 1.49 | 25.00 | 31.00 | 26.00 | 27.00 | 28.00 | 29.00 | 30.00 |
| last_azimut_error (deg) | -3.09 | 1.16 | -4.68 | -0.80 | -4.68 | -3.59 | -3.36 | -2.26 | -0.80 |
| last_long_error (m) | 0.18 | 0.03 | 0.09 | 0.20 | 0.09 | 0.19 | 0.20 | 0.20 | 0.20 |
| last_lat_errors (m) | 0.11 | 0.04 | 0.03 | 0.19 | 0.03 | 0.10 | 0.11 | 0.12 | 0.19 |
Données
|
1666606619 |
|
25 |
|
-0.80 |
|
0.09 |
|
0.19 |
|
|
1666606619 |
|
27 |
|
-0.80 |
|
0.09 |
|
0.19 |
|
|
1666606694 |
|
27 |
|
-2.26 |
|
0.17 |
|
0.13 |
|
|
1666606694 |
|
29 |
|
-2.26 |
|
0.17 |
|
0.13 |
|
|
1666606770 |
|
29 |
|
-4.68 |
|
0.20 |
|
0.12 |
|
|
1666606770 |
|
31 |
|
-4.68 |
|
0.20 |
|
0.12 |
|
|
1666606850 |
|
28 |
|
-3.59 |
|
0.20 |
|
0.03 |
|
|
1666606850 |
|
30 |
|
-3.59 |
|
0.20 |
|
0.03 |
|
|
1666606958 |
|
26 |
|
-3.39 |
|
0.20 |
|
0.11 |
|
|
1666606958 |
|
28 |
|
-3.39 |
|
0.20 |
|
0.11 |
|
|
1666607032 |
|
27 |
|
-4.61 |
|
0.19 |
|
0.12 |
|
|
1666607032 |
|
29 |
|
-4.61 |
|
0.19 |
|
0.12 |
|
|
1666607138 |
|
27 |
|
-2.15 |
|
0.20 |
|
0.09 |
|
|
1666607138 |
|
29 |
|
-2.15 |
|
0.20 |
|
0.09 |
|
|
1666607212 |
|
27 |
|
-3.36 |
|
0.19 |
|
0.10 |
|
|
1666607212 |
|
29 |
|
-3.36 |
|
0.19 |
|
0.10 |
|
|
1666607287 |
|
28 |
|
-3.01 |
|
0.20 |
|
0.11 |
|
|
1666607287 |
|
30 |
|
-3.01 |
|
0.20 |
|
0.11 |
|
Statistiques Tarrière
t0 (unix)temps in (sec)temps out (sec)temps total (sec)incidentIndicateurs
| μ | σ | min | max | D1 | Q1 | median | Q3 | D9 |
| temps in (sec) | 15.89 | 5.34 | 2.00 | 21.00 | 2.00 | 15.00 | 16.00 | 19.00 | 21.00 |
| temps out (sec) | 12.89 | 4.04 | 3.00 | 18.00 | 3.00 | 13.00 | 14.00 | 15.00 | 18.00 |
| temps total (sec) | 39.00 | 21.11 | 9.00 | 93.00 | 9.00 | 33.00 | 36.00 | 38.00 | 93.00 |
Données
|
1666606647 |
|
20 |
|
13 |
|
37 |
|
erreur |
|
|
1666606724 |
|
19 |
|
13 |
|
36 |
|
erreur |
|
|
1666606802 |
|
19 |
|
15 |
|
38 |
|
erreur |
|
|
1666606882 |
|
21 |
|
18 |
|
42 |
|
erreur |
|
|
1666606929 |
|
16 |
|
15 |
|
93 |
|
erreur |
|
|
1666607062 |
|
2 |
|
3 |
|
9 |
|
erreur |
|
|
1666607168 |
|
16 |
|
15 |
|
35 |
|
erreur |
|
|
1666607242 |
|
15 |
|
14 |
|
33 |
|
erreur |
|
|
1666607318 |
|
15 |
|
10 |
|
28 |
|
erreur |
|